
What Is Bollinger Band?
A Bollinger Band is a technical analysis tool that uses three set of lines that interpret the movement of the market. Two of these lines or bands are the “standard deviations” that either move away or toward the centerline or the “simple moving average” as a form of interpretation of the market.
In the chart shown below, the Bollinger band uses the 20-day SMA to monitor the movements of the security. An important thing to note is that when the bands expand, it means the market is more volatile; when the bands contract, it means the market is less volatile.
How to Calculate Bollinger Bands
When calculating Bollinger Bands, you must first get the simple moving average of the security. The most commonly used is the 20-day SMA. The good thing is that the SMA is modifiable, so you can either choose to take the daily closing prices of the last 20 or 30 or 100 days into your calculation. When you already have the data of the 20 past closing prices, add them altogether and divide it by 20.
For the next step, you must calculate the standard deviation of the security. This is basically the average variance of the price, meaning it assesses how wide the price deviates from the average value. To do this, you must first calculate the square root of your variance. Then, multiply the square root by 2. For the upper band, add the product to every point in the SMA. For the lower band, subtract it.
The formula for Bollinger Bands is:
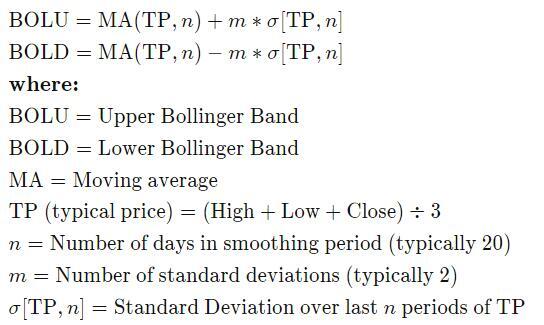
Understanding Bollinger Bands
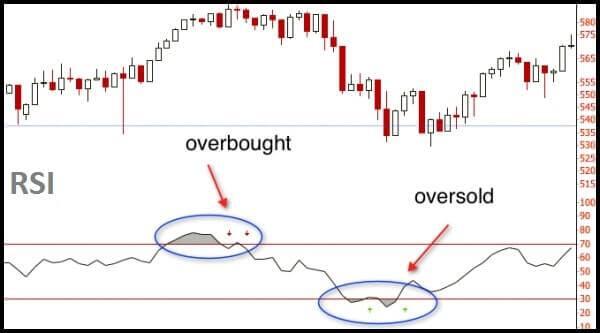
Two of the main principles of Bollinger Band, which is also how most traders interpret the market when using this indicator, are: when the upper band moves closer to the centerline, it signifies that the market is overbought; when the lower band moves closer to the centerline, it signifies that the market is oversold.
Aside from this, there are many terms in the Bollinger Band trading strategy that you must learn as a forex trader.
Breakout
Most of the price action takes place within the space of the two bands, but this does not mean that it is not possible for the security’s actual price to break above or below either bands. When the price breaks outside the parameters of either band, this is called a breakout. This is not exactly a trading signal however; it is a significant event that later on leads to more cohesive market signals. Some traders believe that once the price breaks out above the upper band, it is a sign to sell, as you are betting that the price will fall soon after. Conversely, when the price breaks below the lower band, it is a sign to buy. However, it is an important disclaimer that these do not necessarily mean trading signals. This is a common mistake for traders because the price touching or breaking outside the two bands do not guarantee a reversal in the price action. Generally, breakouts cannot determine the direction of the future price movement, and to what extent it will go.
Squeeze
This is the main concept of the Bollinger Bands indicator. When the two bands contract towards the third line—or the centerline—this is called a squeeze. When this happens, traders interpret it as a period of low price volatility in the market and consecutively, a sign that the market is about to undergo higher volatility, which equates to trading opportunities. Conversely, when the two bands expand, it is a sign that the market will soon undergo decreased volatility and a stronger opportunity to exit a trade. Another important disclaimer is that these are not trading signals but rather only an interpretation of the market. The bands do not guarantee the time of when the price change could take place.
Limitations of Bollinger Bands
The Bollinger Bands Indicator cannot function when applied alone in forex trading. this indicator functions simply by providing information on the volatility of the prices. Its creator actually suggests using the indicator with two or three additional indicators that will aid in providing more trading signals. You must pick additional indicators that will complement it by providing a different type of information, such as the RSI and MACD.
Since this indicator uses the simple moving average, it weighs previous data on the same level as newer data, which means that the more recent data could outweigh old data. Also, not everyone finds a 20-Day SMA applicable to their trading plan, which means others may prefer to use a different time period. It is completely modifiable according to the trader’s preference.
Overall, Bollinger Bands are used to provide trading signals that help the investor attain better profits in forex trading.