

What is RSI?
The Relative Strength Index or simply, RSI, was developed and published in 1978 by technical analyst J. Welles Wilder. The now-popular indicator was created to assess the strength of the price changes of a particular security, unlike other indicators (3. What Is a Moving Average?).
The RSI identifies you buy and sell signals by setting up a 0-100 scale on the price chart. It also determines oversold and overbought levels, which also aid in determining the buy and sell signals of a certain stock.
The scale 0-100 is applied on the price chart, with the 30-mark and below indicating an oversold price asset while a 70-mark and above indicates overbought.
When the price hits the 30- level, it is typically anticipated that the price will soon reverse to a bullish trend or that it climbs up. This mark, which identifies an oversold condition, also triggers the signal for a buying opportunity.
Conversely, when the indicator hits the 70- level, traders anticipate the price to bounce to a bearish trend, or that it slides down the chart. The 70- line identifies an overbought condition and a selling opportunity for traders.
Other than identifying oversold and overbought levels, traders also use RSI in identifying centerline crossovers.
The RSI indicator presents two centerlines (50- level) crossovers:
A rising centerline crossover happens if the price crosses above the 50- level and towards the 70- level on the RSI scale. This is an indicative signal of a rising trend and often interpreted as a strong bullish signal unless the price touches the 70- level.
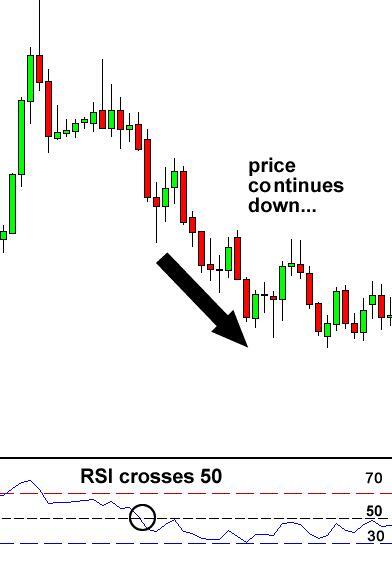
A falling centerline crossover happens if the price crosses below the 50- level and towards the 30- level. This signals a falling trend and is anticipated to continue as a strong bearish signal unless the price touches the 30- level.
How to Trade Using RSI
RSI or Relative Strength Index picks up indicators of the tops and bottoms in the market. These tops and bottoms are represented on the 70- and 30- line, or the oversold and overbought levels, respectively.
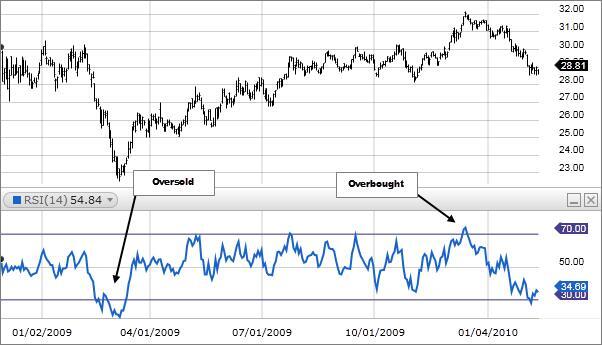
Take, for example, the price chart above. Initially, the price steadies within the range of the centerline, then abruptly falls, crossing below the 30- level and signaling that the stock is oversold. This is the perfect opportunity to buy. As shown above, the trend soon reverses to bullish.
The second box indicates an overbought level since the price crossed above the 70- line. Conversely, this is a sign that the trend is going to fall, which is a perfect selling opportunity.
How to Use RSI in Determining Trend
RSI is different from Bollinger Bands (4. What Is Bollinger Band?). Aside from indicating buy and sell opportunities, the RSI indicator also confirms trend formations. This can be done with the help of using the centerline as a basis.
If you have the feeling that a trend is about to get stronger, you can look at the RSI and determine whether the price is above or below the 50- level (centerline).
If the price is above the 50- line, it is indicative of a possible uptrend.
If the price is below the 50- line, it is indicative of a possible downtrend.
However, this might not always be the case, as your analysis could be wrong. Trend fakeouts could happen on the RSI, and one way to avoid this is to make sure that the price first crosses above or below the centerline. Once it does, this is a confirmation that an up/downtrend has formed.
All the things stated above are how the RSI indicator is used on the price chart. Since it is relatively easy to understand and employ, beginning traders can give it a shot, too.